Testing new extractions of KI Platy SDS archives
Import data
options(stringsAsFactors = FALSE)
library(reshape2)
df <- read.delim("RC_20171026_KI_Platy_newextract_test_data.txt", skip=8)[, 1:7]
df <- df[!df$Well %in% c("A1", "A12", "H1", "H12"), ]
df <- df[!df$Sample.Name %in% c("+", "NEC1", "NTC"), ]
df$CT <- as.numeric(as.character(df$Cт))
## Warning: NAs introduced by coerciondf <- droplevels(df)
df <- cbind(df,
reshape2::colsplit(df$Sample.Name, pattern = "-",
names = c("Date", "Sample", "Dilution")))
df <- cbind(df,
reshape2::colsplit(df$Target.Name, pattern="-",
names= c("Target", "MM")))
df$Treatment <- "Control"
df$CT[is.na(df$CT)] <- 40
df0 <- df
res <- dcast(df, Sample.Name ~ Target.Name, value.var = "CT", fun.aggregate=mean, na.rm=T)
res$C.H <- 2^(res$PaxC - res$C)
res$D.H <- 2^(res$PaxC - res$D)
res$S.H <- apply(res[, c("C.H", "D.H")], 1, sum, na.rm=T)
res$Date <- substr(res$Sample.Name, 1, 4)Plot S/H against PaxC CT values
with(res, plot(S.H ~ PaxC, log="y"))
abline(h=0.3, lty=2)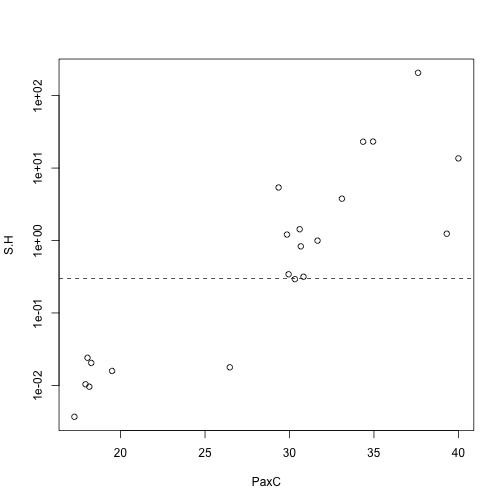
res## Sample.Name C D PaxC C.H D.H
## 1 KI14-FQ019 32.49840 40.00000 30.82860 3.142969e-01 1.734337e-03
## 2 KI14-FQ037 32.28820 40.00000 26.46685 1.768475e-02 8.435599e-05
## 3 KI14-FQ072 25.47790 40.00000 19.49565 1.581843e-02 6.723193e-07
## 4 KI14-FQ098 40.00000 31.18990 33.10480 8.401135e-03 3.770877e+00
## 5 KI14-FQ104 40.00000 40.00000 39.31115 6.203481e-01 6.203481e-01
## 6 KI14-FQ107 26.92495 37.11320 29.35480 5.388374e+00 4.618372e-03
## 7 KI15c-FQ253 23.41830 40.00000 18.04090 2.405699e-02 2.452744e-07
## 8 KI15c-FQ254 24.95570 28.68870 18.14780 8.925199e-03 6.712324e-04
## 9 KI15c-FQ261 29.57985 40.00000 29.85110 1.206853e+00 8.807987e-04
## 10 KI15c-FQ273 24.51605 33.47675 17.92110 1.034480e-02 2.076265e-05
## 11 KI15c-FQ385 23.87770 37.68970 18.26200 2.039416e-02 1.418011e-06
## 12 KI15c-FQ404 32.10775 33.02630 29.94700 2.236400e-01 1.183146e-01
## 13 KI15c-FQ415 29.92285 40.00000 37.61190 2.063644e+02 1.910338e-01
## 14 KI15c-FQ428 34.58480 31.87200 31.66045 1.317295e-01 8.636089e-01
## 15 KI15c-FQ436 40.00000 32.09475 30.31860 1.217890e-03 2.919615e-01
## 16 KI15c-FQ460 40.00000 36.34370 40.00000 1.000000e+00 1.260828e+01
## 17 KI16a-FQ260 37.60260 30.09315 30.60265 7.812771e-03 1.423557e+00
## 18 KI16a-FQ261 37.72010 30.41870 34.94690 1.462796e-01 2.307406e+01
## 19 KI16a-FQ264 38.00685 30.94800 30.66955 6.183760e-03 8.244763e-01
## 20 KI16a-FQ265 37.80630 29.83415 34.35865 9.165453e-02 2.301496e+01
## 21 KI16a-FQ272 37.98125 25.35010 17.26545 5.806612e-07 3.683646e-03
## S.H Date
## 1 3.160312e-01 KI14
## 2 1.776911e-02 KI14
## 3 1.581910e-02 KI14
## 4 3.779278e+00 KI14
## 5 1.240696e+00 KI14
## 6 5.392992e+00 KI14
## 7 2.405724e-02 KI15
## 8 9.596431e-03 KI15
## 9 1.207734e+00 KI15
## 10 1.036557e-02 KI15
## 11 2.039558e-02 KI15
## 12 3.419546e-01 KI15
## 13 2.065554e+02 KI15
## 14 9.953384e-01 KI15
## 15 2.931794e-01 KI15
## 16 1.360828e+01 KI15
## 17 1.431370e+00 KI16
## 18 2.322034e+01 KI16
## 19 8.306601e-01 KI16
## 20 2.310661e+01 KI16
## 21 3.684226e-03 KI16Two groups of samples are visible: those where the host locus (PaxC) amplified in less than 20 cycles, and those in which it amplified after 30 cycles. For those that amplified earlier, S/H ratios are reasonable, whereas for those that amplified later, S/H ratios are all unrealistically high (above 0.3, which is biologically improbable).
Next steps: for those samples that amplified late, test dilutions and different MasterMixes.
Dilutions and alternative MasterMixes
Eight samples that amplified poorly on the previous plate were run again at dilutions of 1:10 and 1:100 with the standard Master Mix, and also at full strength with the PowerUp SYBR MasterMix (PaxC) or the TaqMan Environmental Master Mix (C and D), which are meant to be more robust to PCR inhibitors. Here I’m comparing the data from both plates to see which treatment gives the best amplifications (i.e. lowest CT values). Treatments are “Control” (undiluted, standard Master Mix), “1:10” (diluted 1:10, standard Master Mix), “1:100” (diluted 1:100, standard Master Mix), and “MM” (undiluted, Environmental Master Mix).
library(lsmeans)## Loading required package: estimability## Loading required package: methodsdf <- read.delim("RC_20171027_KI_CTAB_dil_mm_test_data.txt", skip=8)[, 1:7]
df <- df[!df$Well %in% c("A1", "A12", "H1", "H12"), ]
df <- df[!df$Sample.Name %in% c("+", "NEC1", "NTC"), ]
df$CT <- as.numeric(as.character(df$Cт))## Warning: NAs introduced by coerciondf <- droplevels(df)
df <- cbind(df,
reshape2::colsplit(df$Sample.Name, pattern = "-",
names = c("Date", "Sample", "Dilution")))
df <- cbind(df,
reshape2::colsplit(df$Target.Name, pattern="-",
names= c("Target", "MM")))
df$Treatment <- paste0(df$Dilution, df$MM)
df$Treatment <- gsub("EN", "MM", df$Treatment)
df$Treatment <- gsub("PU", "MM", df$Treatment)
df$CT[is.na(df$CT)] <- 40
dff <- rbind(df0, df, all=T)
dff <- subset(dff, dff$Sample %in% df$Sample)
mod <- with(dff, lm(CT ~ Treatment * Target))
plot(lsmeans(mod, specs=c("Treatment", "Target")), horizontal=FALSE)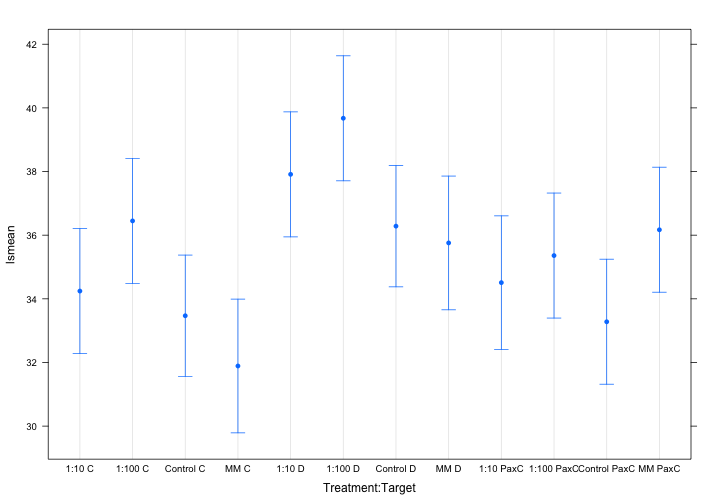
Results:
TaqMan Environmental MasterMix leads to the lower CT values for both clade C and D amplification, but PaxC amplification is best in control samples. This suggests the PowerUp SYBR MasterMix provides no benefit, but the TaqMan Environmental MasterMix does. It is possible that 1:10 dilution AND use of TaqMan Environmental MasterMix provides even better amplification (I can test this next). Also, we could develop a TaqMan probe for the PaxC assay and then use this with the TaqMan Environmental MasterMix to potentially improve PaxC amplification.
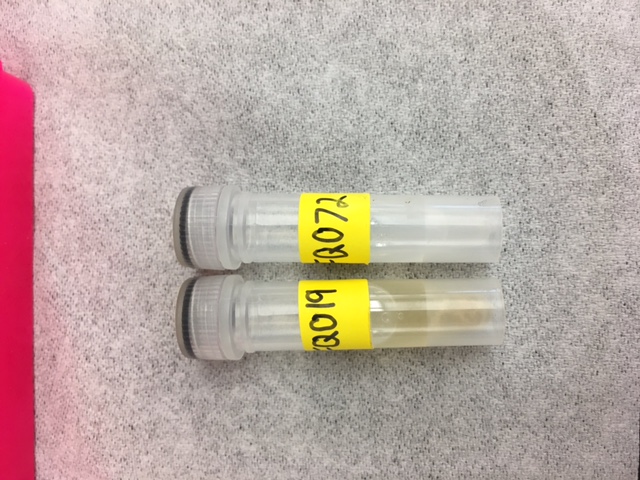
I also had a look at the SDS archives of the samples that amplified well (on the first plate) and the samples that amplified poorly. In general, the samples that performed poorly had much more skeleton/debris/mucus in the SDS archive, while the samples that performed well had very little apparent skeleton and biomass in the sample. This suggests that for the larger samples (i.e., more stuff in the tube), either DNA is not preserved as well, or more PCR inhibitors are co-precipitating with the DNA. We can try to modify the extraction protocol (more proteinase K?) to see if this improves the yield…